介绍
- Grafana是一个开源的度量分析和可视化套件,它最常用于可视化基础设施和应用程序分析的时间序列数据
- InfluxDB是一款优秀的时间序列数据库,适合存储设备性能、日志、物联网传感器等带时间戳的数据
- 可以理解为Grafana是前端展示,InfluxDB是后端数据库,通过配置Grafana即可连接到数据库上
二者都提供了docker镜像:
docker run --name=grafana  -d -p 3000:3000 grafana/grafana
docker run --name=influxdb -d -p 8086:8086 influxdb
- 3000即为grafana的web端口
- 8086为influxdb的web端口,influx客户端通过这个端口连接到数据库中
InfluxDB中文文档
Grafana Documentation
influxdb
安装完之后默认是不开启身份认证的,即不需要任何用户名密码即可链接。
influxdb需要新建数据库,但不需要新建表,直接插入数据即可。数据需要遵循如下格式
<measurement>[,<tag-key>=<tag-value>...] <field-key>=<field-value>[,<field2-key>=<field2-value>...] [unix-nano-timestamp]
- measurement: 测量的对象
- tag: 被索引的属性
- field: 测量值
- timestamp: 时间戳
在概念上,你可以将measurement类比于SQL里面的table,其主键索引总是时间戳。tag和field是在table里的其他列,tag是被索引起来的,field没有。不同之处在于,在InfluxDB里,你可以有几百万的measurements,你不用事先定义数据的scheme,并且null值不会被存储。
influxdb帮我们解决了时间序列的数据存储,每条数据可以理解为在时间轴上的一个点:
influx客户端
如果你已经在本地安装运行了InfluxDB,你就可以直接使用influx命令行
➜  ~ influx
Connected to http://localhost:8086 version 1.7.6
InfluxDB shell version: v1.7.6
Enter an InfluxQL query
> show databases
name: databases
name
----
_internal
net
> use net
Using database net
> show  measurements
name: measurements
name
----
network
> select * from network
name: network
time                City  Country IP              VPS   avg      loss
----                ----  ------- --              ---   ---      ----
1560766510310921400 香港    中国      47.240.5.71     阿里云   493.223  0
1560766514758224300 东京    日本      108.61.201.151  Vultr 425.24   0
1560766519247446800 新加坡   新加坡     45.32.100.168   Vultr 483.182  0
1560766523741031300 阿姆斯特丹 荷兰      108.61.198.102  Vultr 461.526  0
1560766528175280200 巴黎    法国      108.61.209.127  Vultr 468.976  0
1560766532727756400 法兰克福  德国      108.61.210.117  Vultr 465.005  0
1560766537240017200 伦敦    英国      108.61.196.101  Vultr 499.33   0
1560766541647065800 达拉斯   美国      108.61.224.175  Vultr 395.65   0
通过python操作influxdb
需要先安装相应包:
pip install influxdb
安装好之后即可用influxdb中的InfluxDBClient模块来操作数据库
from influxdb import InfluxDBClient
client=InfluxDBClient('localhost', 8086, 'root', 'root', 'example')
client.create_database('example')
json_body = [
    {
        "measurement": "network",
        "tags": {
            "Country": "China",
            "City": "HongKong",
            "VPS": "Aliyun"
        },
        "fields": {
            "avg": 0.64,
            "loss":0.2
        }
    }]
client.write_points(json_body)
Grafana
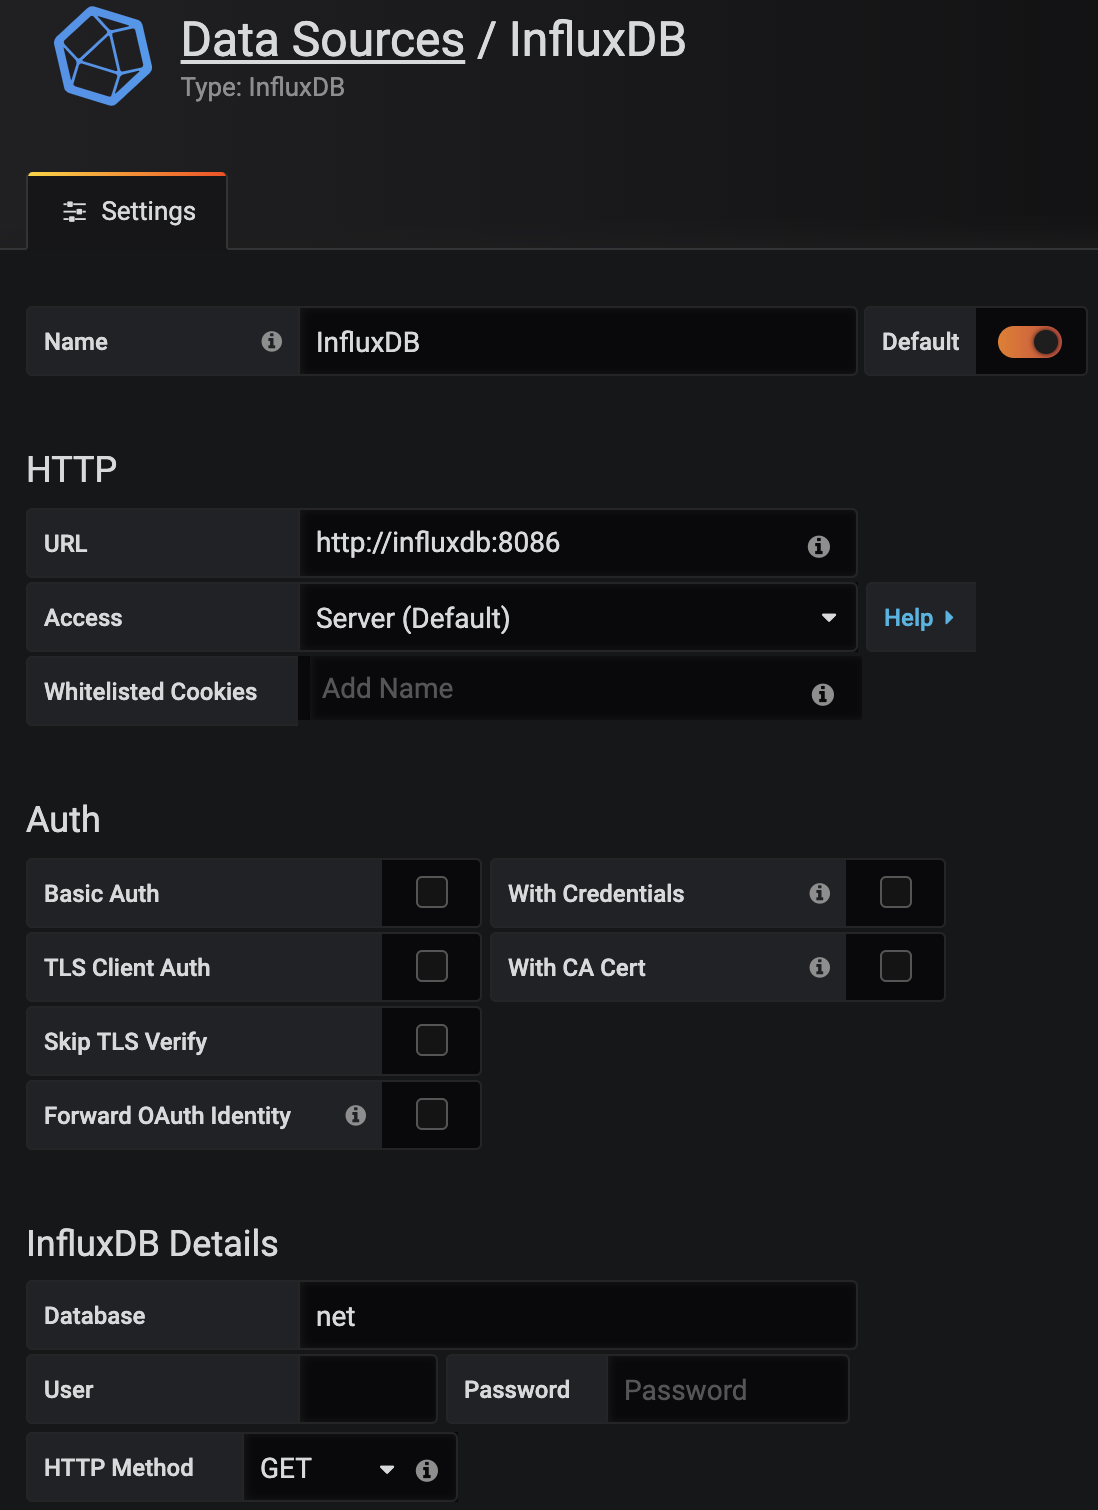
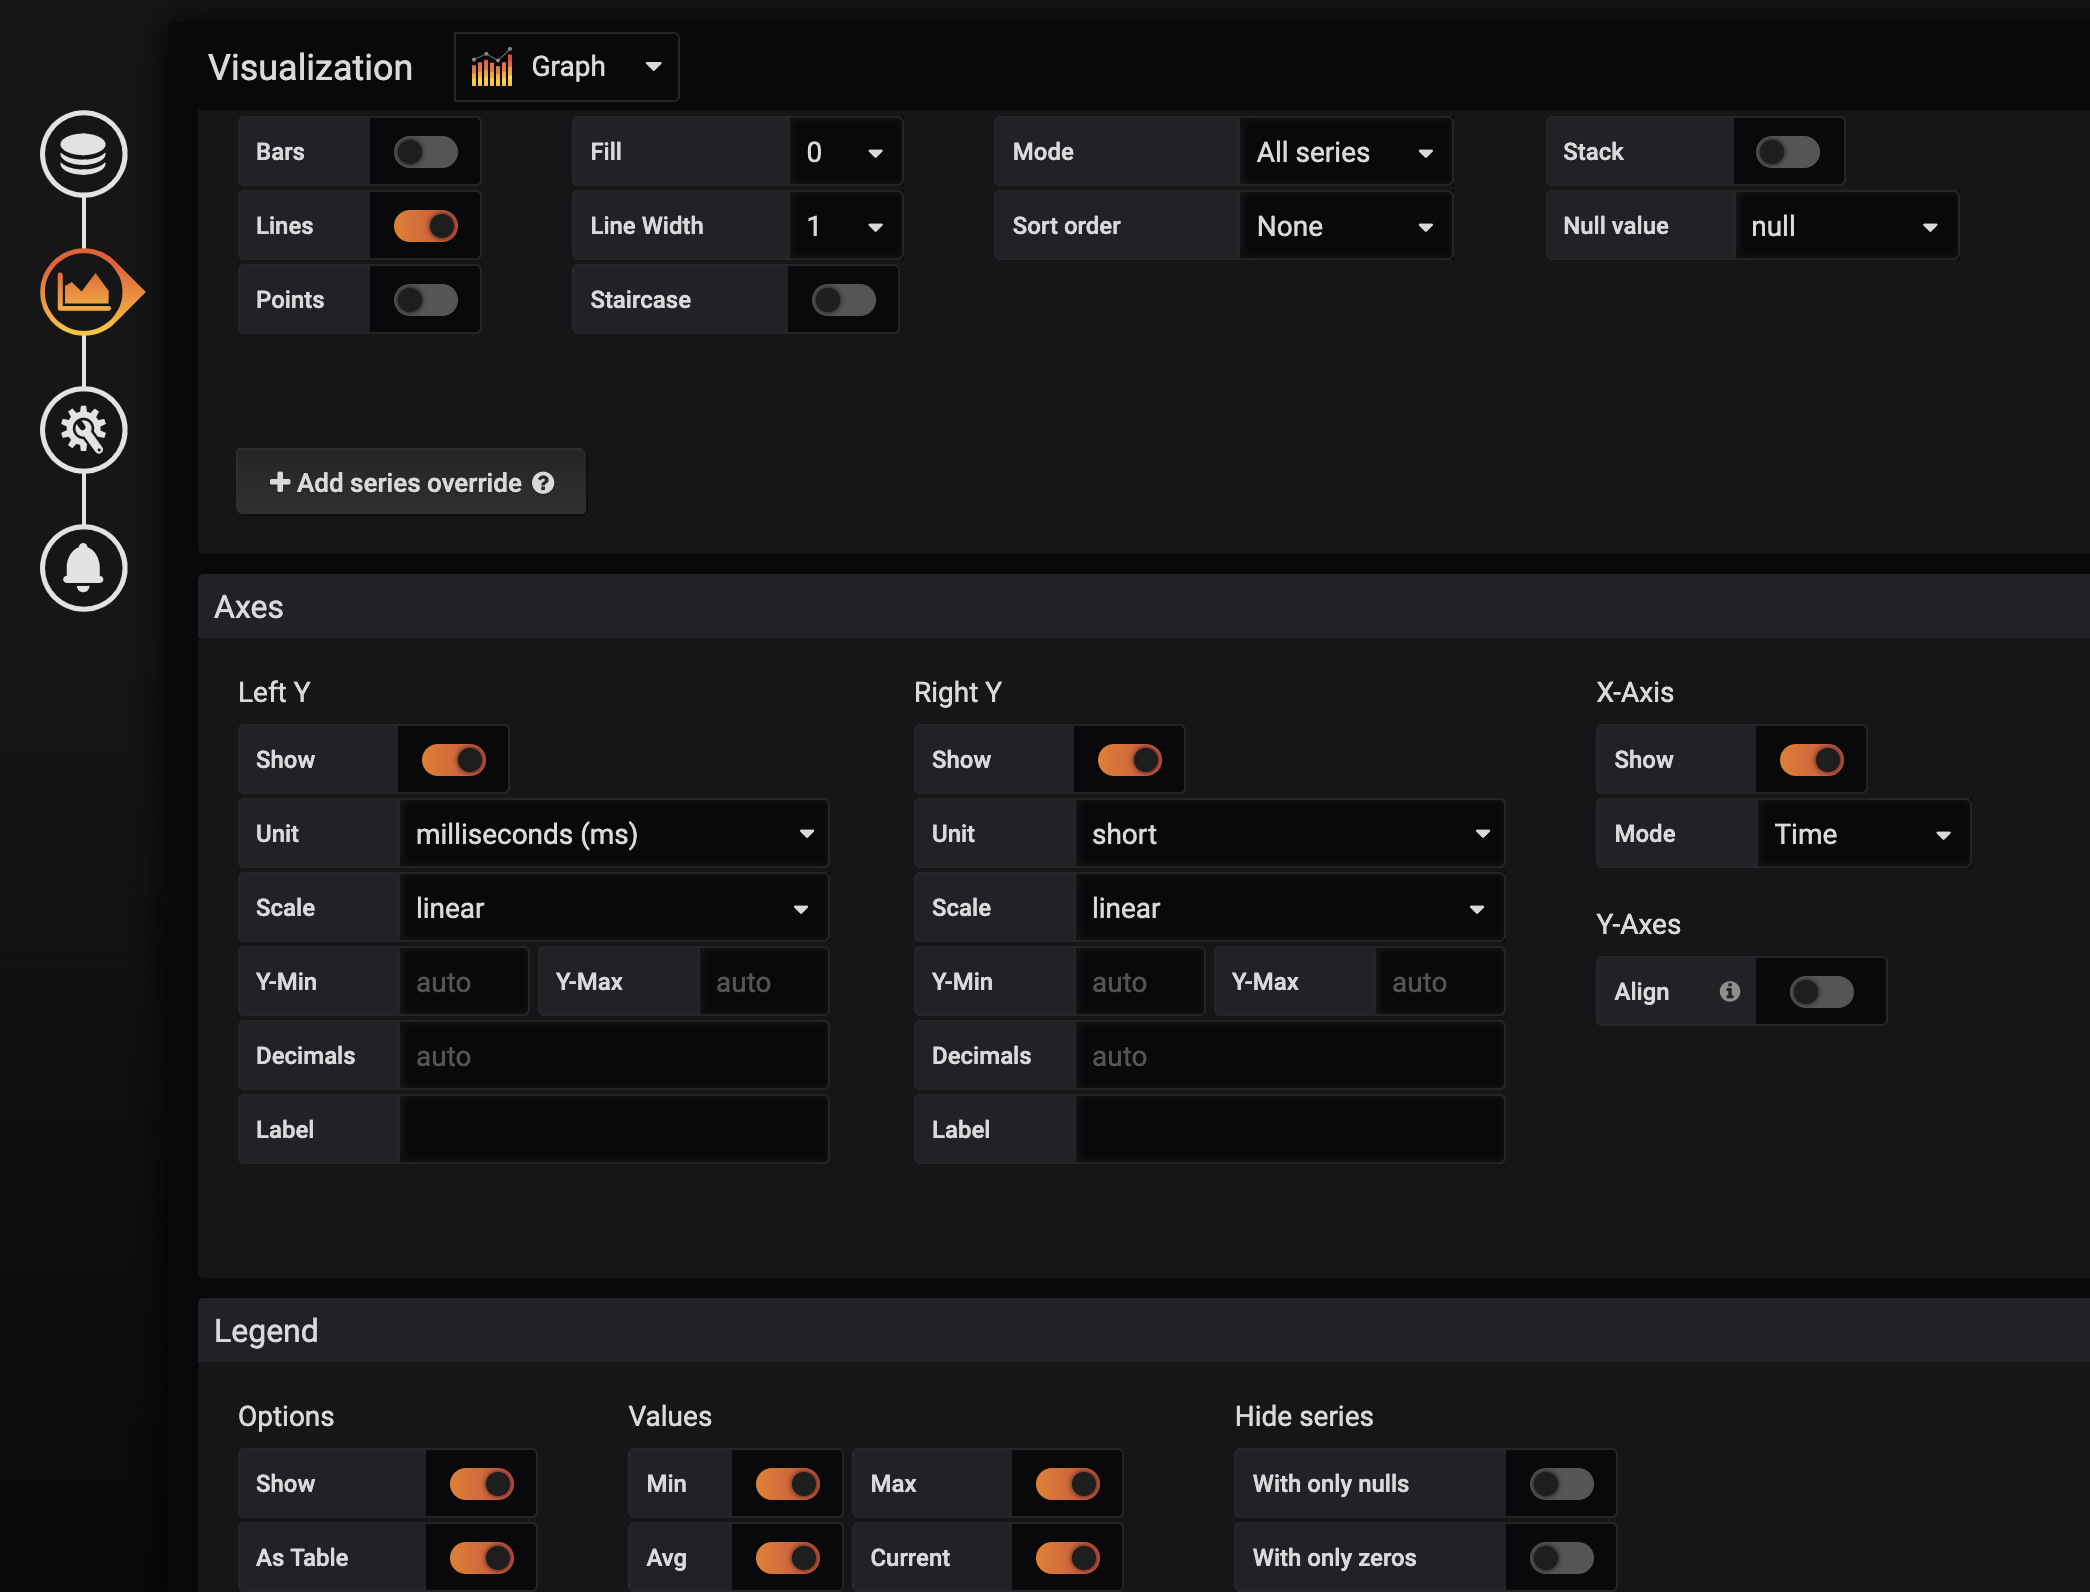
对于Grafana的配置操作需要在其提供的web接口上通过鼠标操作,涉及到较多的图片,参考如下:
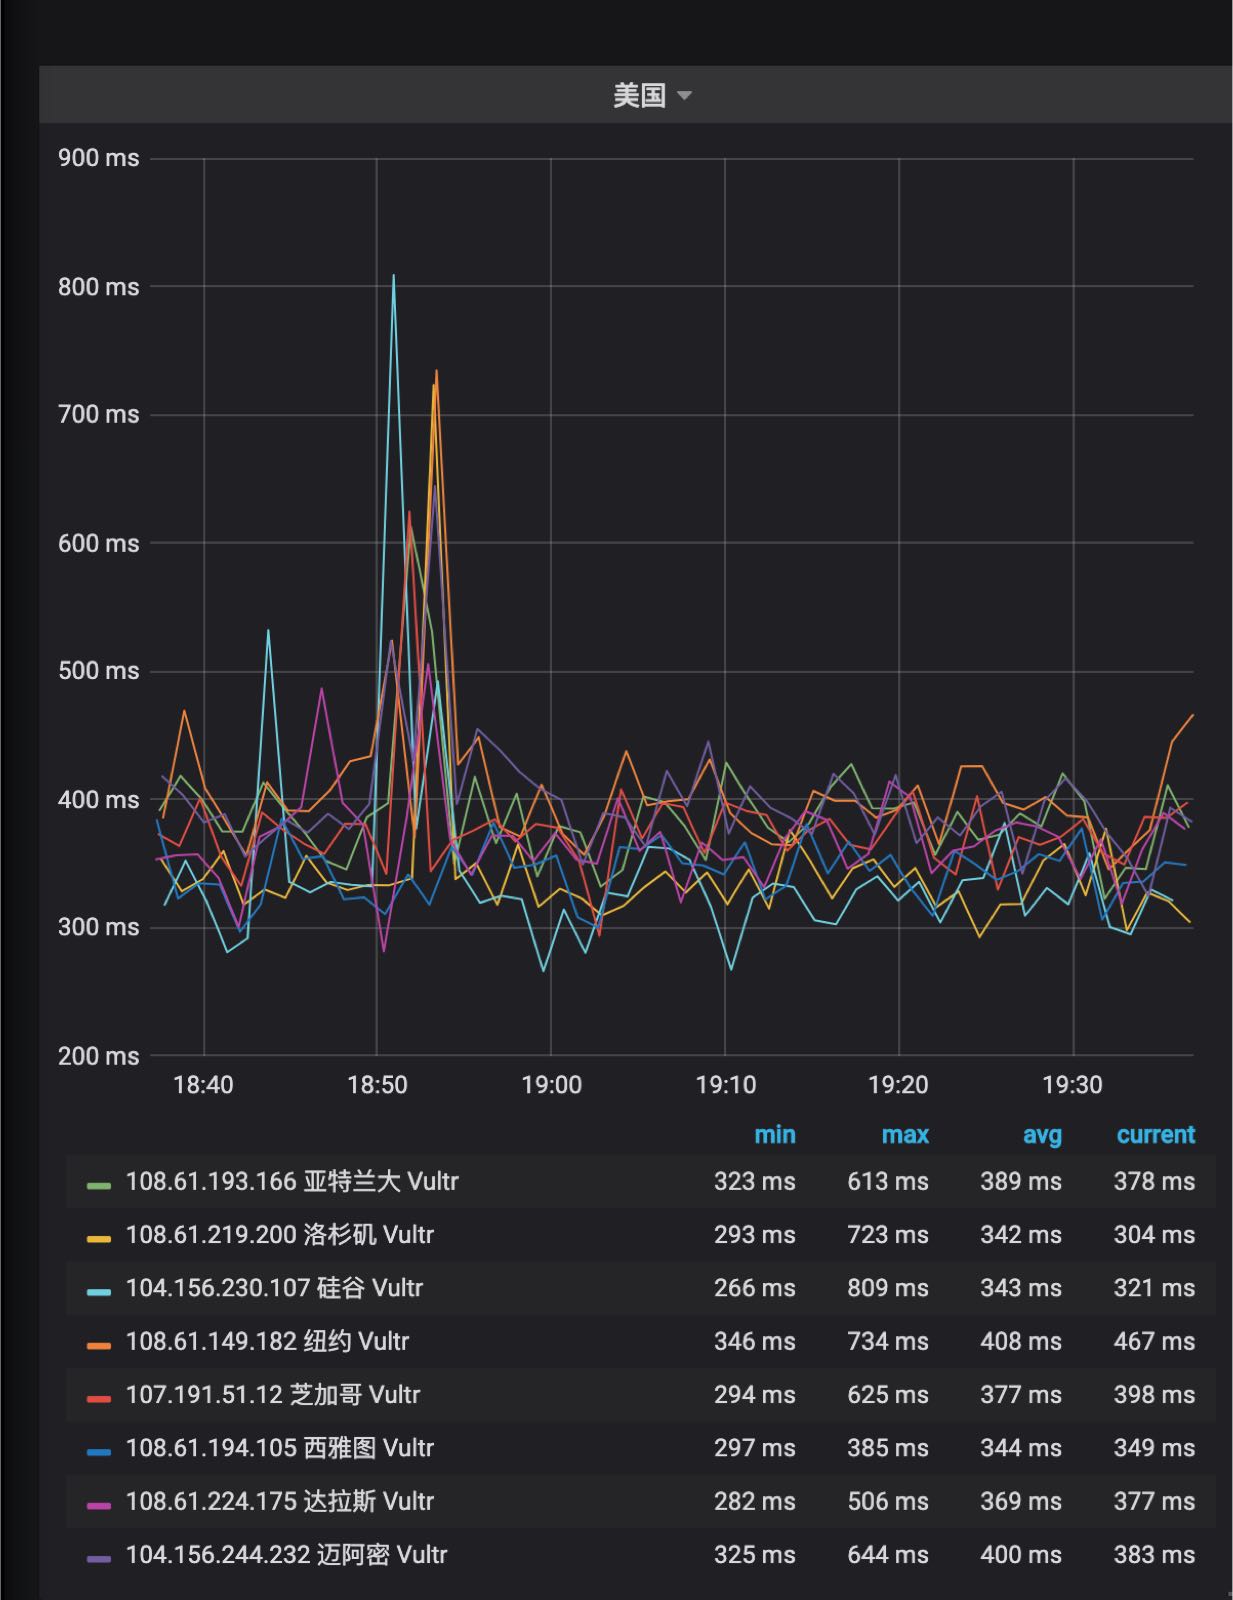
网络监控
意图监控对不同IP的链路访问情况,通过ping收集到延时和丢包率两个测量值
docker-compose.yml
version: '2'
services:
  grafana:
    image: grafana/grafana:latest
    depends_on:
      - influxdb
    ports:
      - 3000:3000
    links:
      - influxdb
  influxdb:
    image: influxdb:latest
    ports:
      - 8086:8086
python收集脚本
import json,os,re
from influxdb import InfluxDBClient
a = json.load(open("config.json"))
client=InfluxDBClient('localhost', 8086, 'root', 'root', 'net')
client.drop_database('net')
client.create_database('net')
def ping(ip):
    c = os.popen("ping "+ip+" -c 5").read()
    avg = re.findall("[0-9.]*/([0-9.]*)/[0-9.]*/[0-9.]*",c)
    loss = re.findall("([0-9.]*)% packet loss",c)
    if len(avg)== 1 and len(loss) == 1:
        return float(avg[0]),float(loss[0])
    elif len(avg)== 0 and len(loss) == 1:
        return 0.0,float(loss[0])
    else:
        return 0.0,100.0
def writedb():
    global client
    for i in range(len(a)):
        avg,loss = ping(a[i]["IP"])
        json_body = [
        {
            "measurement": "network",
            "tags": {
                "Country": a[i]["Country"],
                "City": a[i]["City"],
                "VPS": a[i]["VPS"],
                "IP":a[i]["IP"]
            },
            "fields": {
                "avg": avg,
                "loss":loss
            }
        }]
        print json_body
        client.write_points(json_body)
while 1:
    writedb()
config.json
[
    {"Country":"日本","City":"东京","VPS":"Vultr","IP":"108.61.201.151"},
    {"Country":"新加坡","City":"新加坡","VPS":"Vultr","IP":"45.32.100.168"},
    {"Country":"荷兰","City":"阿姆斯特丹","VPS":"Vultr","IP":"108.61.198.102"},
    {"Country":"法国","City":"巴黎","VPS":"Vultr","IP":"108.61.209.127"},
    {"Country":"德国","City":"法兰克福","VPS":"Vultr","IP":"108.61.210.117"},
    {"Country":"英国","City":"伦敦","VPS":"Vultr","IP":"108.61.196.101"},
    {"Country":"美国","City":"达拉斯","VPS":"Vultr","IP":"108.61.224.175"},
    {"Country":"美国","City":"西雅图","VPS":"Vultr","IP":"108.61.194.105"},
    {"Country":"美国","City":"芝加哥","VPS":"Vultr","IP":"107.191.51.12"},
    {"Country":"美国","City":"亚特兰大","VPS":"Vultr","IP":"108.61.193.166"},
    {"Country":"美国","City":"洛杉矶","VPS":"Vultr","IP":"108.61.219.200"},
    {"Country":"美国","City":"迈阿密","VPS":"Vultr","IP":"104.156.244.232"},
    {"Country":"美国","City":"纽约","VPS":"Vultr","IP":"108.61.149.182"},
    {"Country":"美国","City":"硅谷","VPS":"Vultr","IP":"104.156.230.107"},
    {"Country":"澳大利亚","City":"悉尼","VPS":"Vultr","IP":"108.61.212.117"}
]
Grafana配置
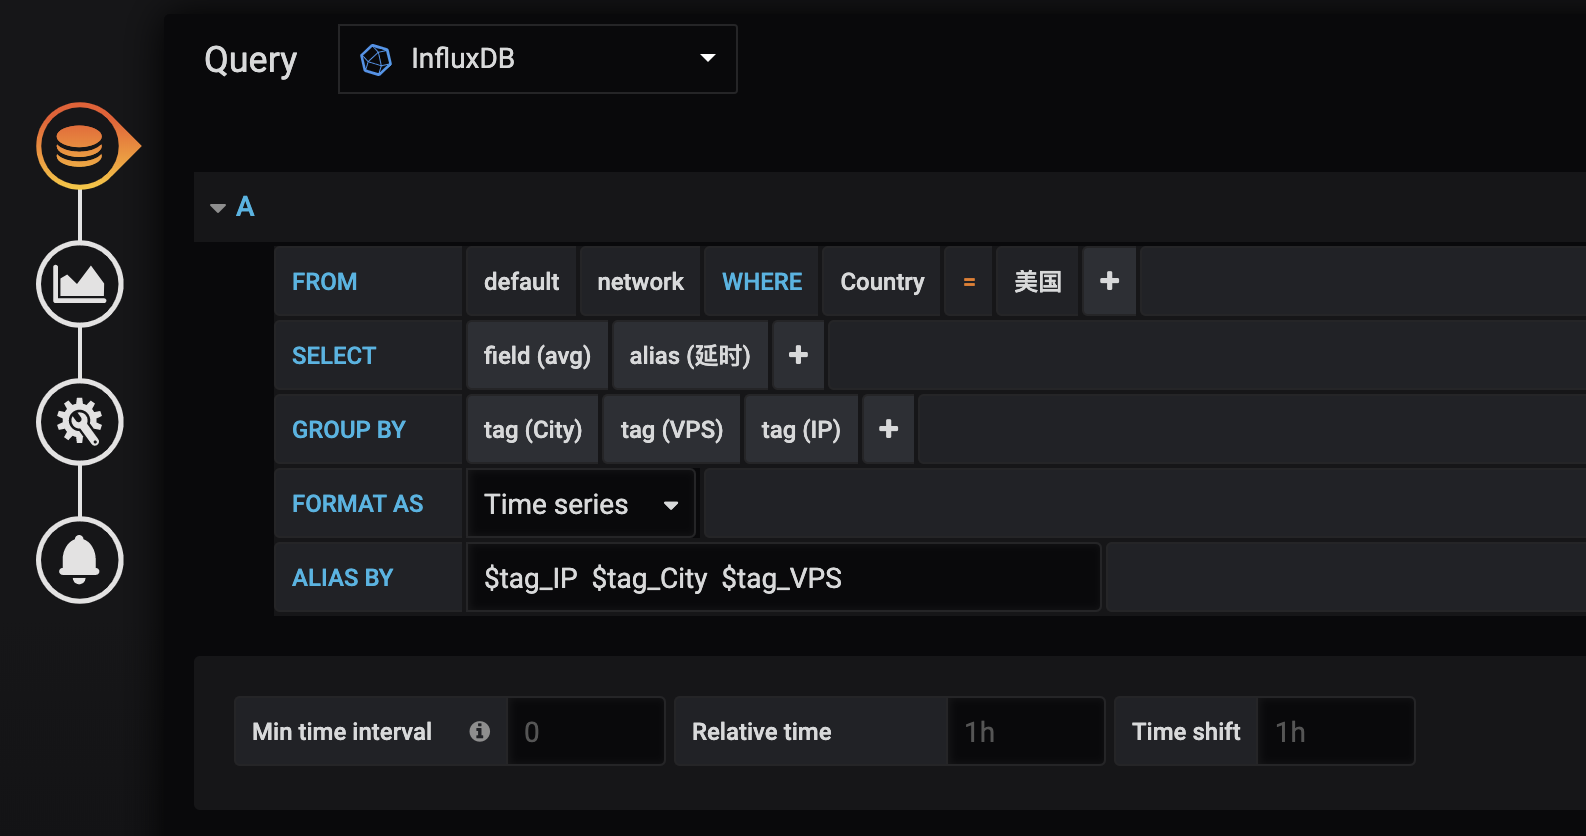
在这里有几个小技巧:
- 可以通过
GROUP BY中的tag标签直接进行分类 - 在ALIAS BY通过参数$tag_exampletag对标签更改显示别名
参考:https://grafana.com/docs/features/datasources/influxdb/
最终效果